Signal Generator
[1]:
%pylab inline
pylab.rcParams['savefig.dpi'] = 300
%pylab is deprecated, use %matplotlib inline and import the required libraries.
Populating the interactive namespace from numpy and matplotlib
[2]:
from caf_verilog.sig_gen import SigGen, lut_values
[3]:
fs = 625e3
n_bits = 8
freq_res = 200
f_out = 20e3
[4]:
values = lut_values(n_bits)
[5]:
len(values)
[5]:
512
[6]:
sg = SigGen(freq_res, fs, n_bits)
[7]:
sg.phase_bits
[7]:
12
[8]:
sg.gen_tb(f_out)
[9]:
from caf_verilog.io_helper import read_complex_output
[10]:
output_values = read_complex_output(sg.test_output_filename)
[11]:
from caf_verilog.quantizer import quantize
[12]:
vals = 40
n = arange(0, vals)
[13]:
cref = cos(2 * pi * (f_out / fs) * n)
cquant = quantize(cref, n_bits)
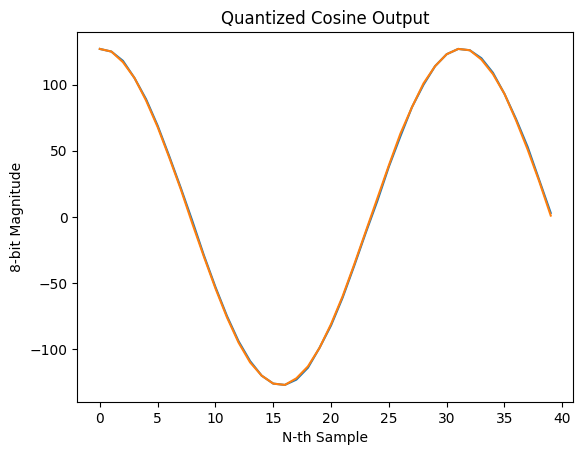
plot(array(output_values[:vals]).real)
plot(cquant)
title(r'Quantized Cosine Output')
ylabel("8-bit Magnitude")
xlabel("N-th Sample")
savefig('dds_one_cycle.png')
[14]:
sref = sin(2 * pi * (f_out / fs) * n)
squant = quantize(sref, n_bits)
plot(array(output_values[:vals]).imag)
plot(squant)
title(r'Quantized Sine Output')
ylabel("8-bit Magnitude")
xlabel("N-th Sample")
[14]:
Text(0.5, 0, 'N-th Sample')

[15]:
Px, ff = psd(output_values, 2**12, fs)
plot(ff, 10*log10(Px))
xlim([15000, 25000])
ylim([-80, 20])
xlabel("Frequency (Hz)")
title("Output Spectrum Centered at 20kHz")
savefig('sig_gen_8_200.png')
